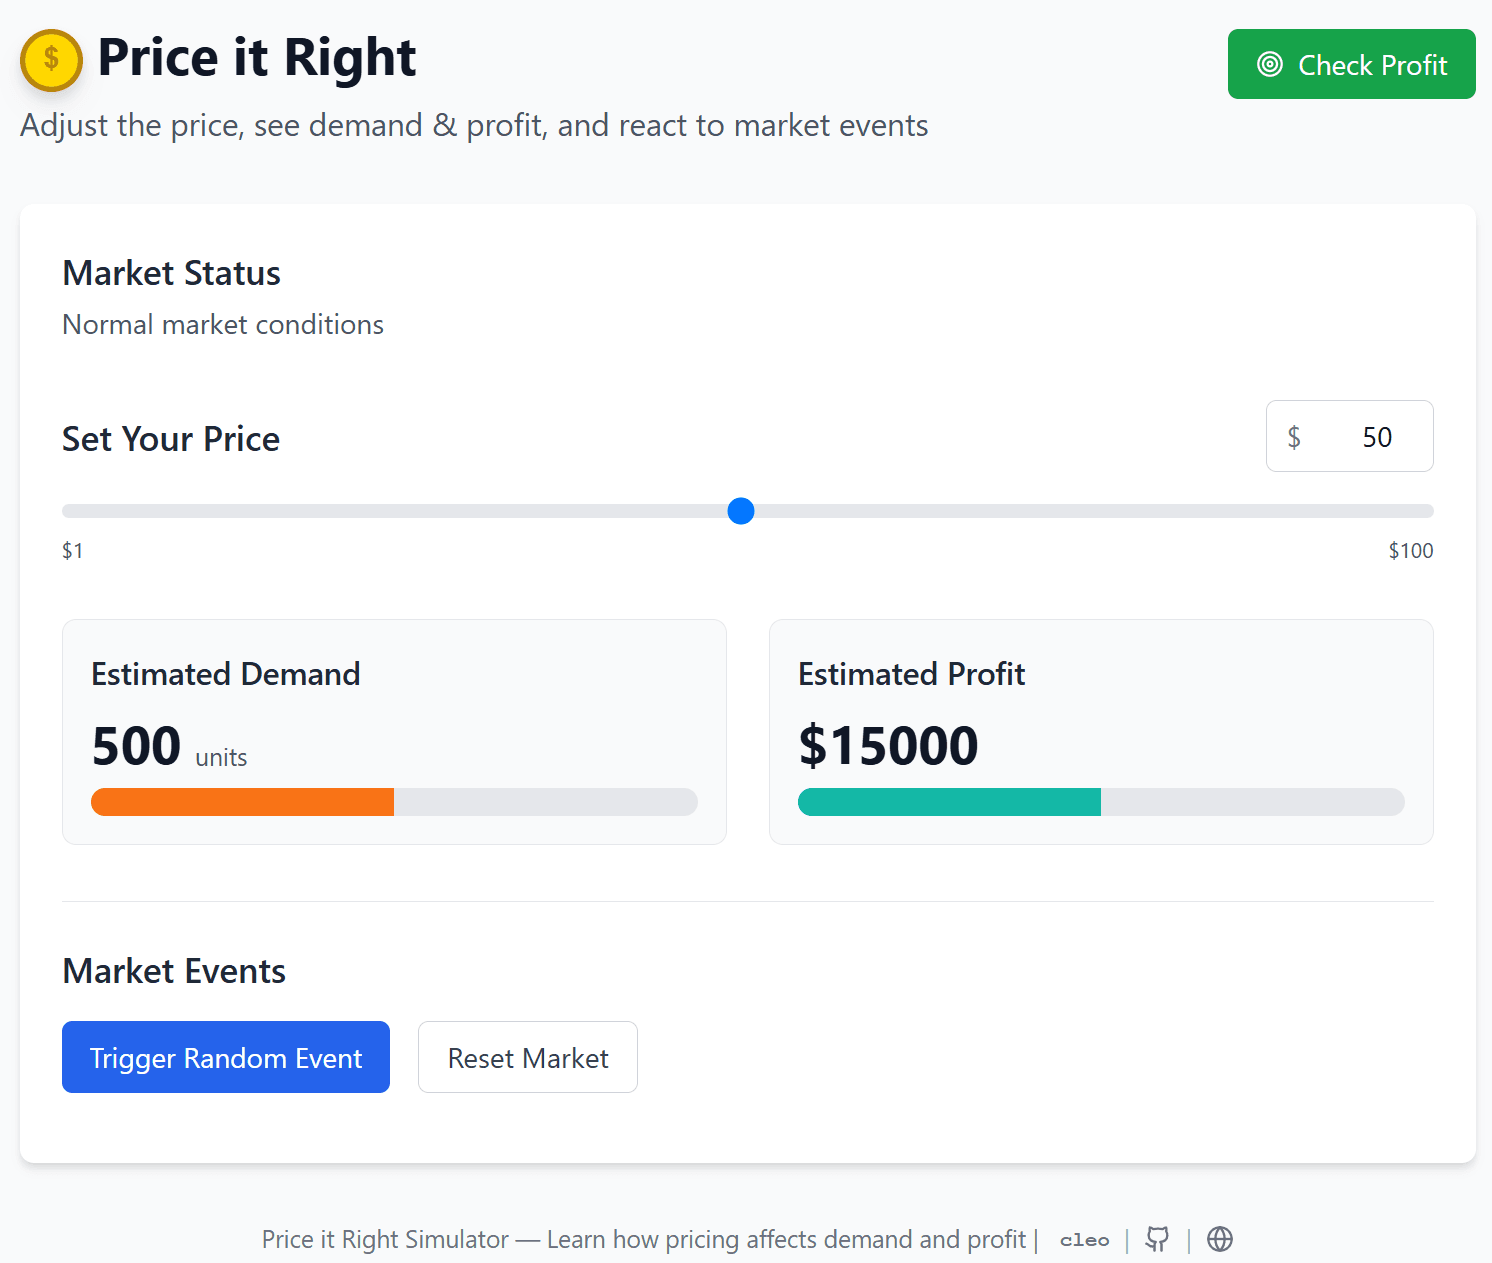
Price It Right is an interactive pricing and demand simulator built with React, TypeScript, and Vite. Users drag a price slider and watch demand, revenue, and profit update live via Chart.js - with random market twist events (a crash, a new competitor, a viral trend) that force them to react rather than just observe. It was built as a final project to teach the pricing and supply & demand unit in Tesla STEM High School's Business & Econ class, and has since been adopted as official teaching material for that course.
Pricing, elasticity, and profit optimization are usually taught through static graphs and formulas - Profit = (Price − Cost) × Demand - that describe the relationship between price and demand without letting a student feel it change. Students could recite that raising price lowers demand, but had no hands-on way to explore the shape of that tradeoff or see how external shocks (a competitor entering, a market crash) shift the optimal price.
Live Chart.js demand curve driven by a single price slider
A single responsive slider controls price; every change recalculates demand via an elasticity function and immediately redraws the Chart.js demand curve alongside live revenue and profit figures.
Reason:
Immediate visual feedback turns an abstract formula into something students can explore by trial and error - moving the slider and watching profit peak then fall communicates elasticity far faster than a lecture.
Tradeoff:
A single simplified elasticity model is less rigorous than a full econometric demand model, trading realism for something intuitive enough to teach with in one class period.
Randomized market events layered on top of the base simulation
A "Trigger Random Event" action can inject a market crash, a new competitor, or a viral trend, each temporarily reshaping the demand curve and forcing the student to re-find their optimal price.
Reason:
Static pricing exercises teach students to find one right answer; real markets don't hold still. Random events push students to practice adaptive pricing strategy, not just curve-reading.
Tradeoff:
Randomized events make outcomes less repeatable for direct classroom comparison between students, which the "Reset Market" control offsets by letting a scenario be replayed from a clean state.
- Adopted as official teaching material in Tesla STEM High School's Business & Econ class for the Pricing, Supply & Demand, Game Theory, and Econ Strategy units.
- Visualizes pricing strategy, elasticity, and profit optimization through a live, interactive demand curve rather than static graphs.
- Fully responsive slider-driven UI that models Profit = (Price − Cost) × Demand and Revenue = Price × Demand in real time.
- A tool built to teach yourself a concept can end up teaching a whole classroom - this started as a personal final project and became course material.
- Interactive visualization makes abstract economic concepts immediately intuitive in a way static graphs and formulas can't.
- Introducing randomness (market events) on top of a clean simulation is what turns a demo into a genuine practice tool for strategic thinking.